Decomposition more generally

Notes on Das Gupta

A misnomer..

  • Das Gupta uses terms such as “A-effect”, “B-effect”.

  • People (self included) are lax with the word “effect” in many areas of statistics

  • It’s probably even less appropriate in DG decomposition

scot_v_eng
# A tibble: 2 × 6
  country  n_people n_women1544 n_births propw1544   bpw
  <chr>       <dbl>       <dbl>    <dbl>     <dbl> <dbl>
1 Scotland  5546900     1064441    45763     0.192  43.0
2 England  58620101    11583779   567708     0.198  49.0
dgnpop(scot_v_eng,
       pop = "country",
       factors=c("propw1544","bpw")) |>
  dg_table()
          England Scotland    diff decomp
propw1544   9.090    8.827 -0.2626  18.31
bpw         9.545    8.373 -1.1717  81.69
crude       9.685    8.250 -1.4343 100.00
A misnomer..

  • Das Gupta uses terms such as “A-effect”, “B-effect”.

  • People (self included) are lax with the word “effect” in many areas of statistics

  • It’s probably even less appropriate in DG decomposition

scot_v_eng2
# A tibble: 2 × 6
  country  n_people n_tesco n_births proptsco   bpt
  <chr>       <dbl>   <dbl>    <dbl>    <dbl> <dbl>
1 Scotland  5546900     224    45763   0.0404  204.
2 England  58620101    2582   567708   0.0440  220.
dgnpop(scot_v_eng2,
       pop = "country",
       factors=c("proptsco","bpt")) |>
  dg_table()
         England Scotland    diff decomp
proptsco   9.342    8.565 -0.7770  54.17
bpt        9.282    8.624 -0.6574  45.83
crude      9.685    8.250 -1.4343 100.00
(other supermarkets are available)

this is true!

if England and Scotland had same number of tesco stores per person, but differed in the number of births per tesco store, the England/Scotland birth rate difference would be 46% of the size that it is.


but is it useful?

probably not…

(other supermarkets are available)

Arithmetic, not stochastic

  • all we are doing is moving numbers around!

  • there’s no estimation happening

  • but we are in the world of counterfactuals..

counterfactuals, but not potential outcomes

counterfactual:

  • if Scotland had X tesco stores per person, and Z births per tesco, what would the nr births per person be?

potential outcome:

  • if we gave Scotland more tesco stores, what would the nr births per person be?
  • if we give a Scottish person access to 1 more tesco store, what would the probability of them giving birth be?

counterfactuals

“Standardized rates are ‘artificial’, summaries of a world we do not live in.”

(Ben, this morning)

dgnpop(scot_v_eng2,
       pop = "country",
       factors=c("proptsco","bpt")) |>
  dg_table()
         England Scotland    diff decomp
proptsco   9.342    8.565 -0.7770  54.17
bpt        9.282    8.624 -0.6574  45.83
crude      9.685    8.250 -1.4343 100.00
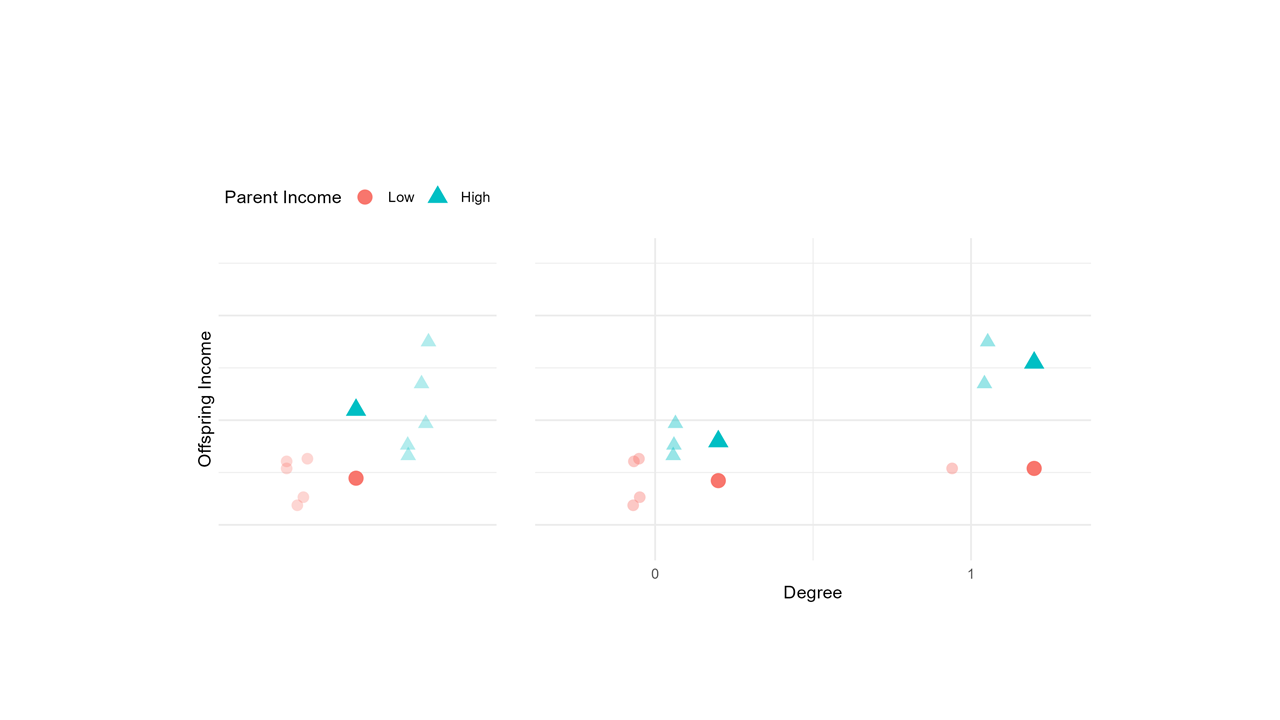
estimands

What is your estimand?

  • a descriptive disparity between two populations’ birth rates were they to be the same with respect to the number of births per tesco store?

  • a causal difference in the numbers of birth between two populations due to their different numbers of tesco stores?

Das Gupta

What does it decompose? \(R_a - R_b\) : Group difference in calculated rate
Into what parts? Whatever bits make up how we’re calculating the rate
How? averaging over the possible calculations substituting in each groups’ parts of the rate calculation
Counterfactual What would the difference in rates be if [all parts of rate function but \(\alpha\)] were the same between \(a\) and \(b\)?

Regression methods of decomposition

macro vs micro

Aggregate counts

# A tibble: 2 × 4
  population n_people n_tesco n_births
  <chr>         <dbl>   <dbl>    <dbl>
1 Scotland        500      20       90
2 England        6000     200      500

Individual People

   person population tesco birth
1       1    England     0     1
2       2    England     0     0
3       3    England     0     0
4       4   Scotland     1     1
5       5    England     0     0
6       6    England     0     0
7       7    England     1     0
8       8    England     0     1
9       9   Scotland     0     0
10     10    England     0     1
11    ...        ...   ...   ...

macro vs micro

Aggregate counts

# A tibble: 2 × 4
  population n_people n_tesco n_births
  <chr>         <dbl>   <dbl>    <dbl>
1 Scotland        500      20       90
2 England        6000     200      500

Intermediate Units

    datazone population ntesco nbirth
1  S01006653   Scotland      1     10
2  E01002868    England      2     43
3  E01005123    England      3     67
4  E01006655    England      1    102
5  E01009123    England      2    234
6  S01008935   Scotland      0     22
7  E01012345    England      2     54
8  E01016421    England      4     78
9  E01033732    England      2     94
10 E01000001    England      5     89
11       ...        ...    ...    ...

regression: estimating conditional expectations

  • \(\mathbb{E}[Y|X]\) - expected value of Y conditional upon X
    • expected number/probability of births given number/presence of tesco, for a given population.
  • estimating conditional expectation allows us to move towards a decomposition of group disparities into:
    • differential prevalence (like Das Gupta)
    • differential effects

Oaxaca-Blinder

What does it decompose? \(\mathbb{E}_a[Y] - \mathbb{E}_b[Y]\) : Group difference in expected value of Y
Into what parts? differences in \(\mathbb{E}[X]\) (“endowments”)
differences in \(\mathbb{E}[Y|X]\) (“returns”)
How? Estimates functional relationship between X and outcome Y in each group
Counterfactual What would the difference in Y be if group B had group A’s ‘endowments’ \(\mathbb{E}_a[X]\), but kept the same ‘returns’ \(\mathbb{E}_b[Y|X]\)?
What would the difference in \(Y\) be if group B kept its own characteristics X but had the same X-Y relationship as in group A?

Oaxaca-Blinder?

  • Rahimi & Nazari 2021: A detailed explanation and graphical representation of the Blinder-Oaxaca decomposition method with its application in health inequalities

  • Hlavac 2014: oaxaca: Blinder-Oaxaca Decomposition in R

  • A rabbit hole: Oaxaca & Sierminska 2025 Oaxaca-Blinder meets Kitagawa: What is the link?

Group difference or Group effect?

group “difference”

aim is to understand why (structurally) a disparity exists


How much of the difference in Y between groups can be attributed to the fact that groups have different distributions/effects of X on Y?

group “effect”

aim is to understand how a process/mechanism works


How much of the effect on Y of being in group A vs B is because the grouping has an effect on M and M has an effect on Y?

Mediation

What does it decompose? \(\mathbb{E}[Y^a] - \mathbb{E}[Y^b]\) : Group effect.
Expected change in Y had an entity been in group \(a\) vs in group \(b\).
Into what parts? Direct effect of group on Y \(\mathbb{E}[Y^{a,M^b}] - \mathbb{E}[Y^{b,M^b}]\)
Indirect effect of group on Y via M \(\mathbb{E}[Y^{a,M^a}] - \mathbb{E}[Y^{a,M^b}]\)
How? Estimates the functional relationship between the grouping and M, and the joint relationship of the grouping and M on the outcome.
Counterfactual How much would Y change were a unit to move from group \(a\) to \(b\) but hold \(M\) constant?
How much would Y change were a unit to stay in group \(a\), but changed its \(M\) the amount by which we would expect \(M\) to change if it moved from group \(a\) to \(b\).

Mediation?

  • it’s probably not want you want.

  • requires much more stringent causal assumptions that are almost impossible to satisfy (no unmeasured confounding of Group -> Y, of Group -> M, of M -> Y).


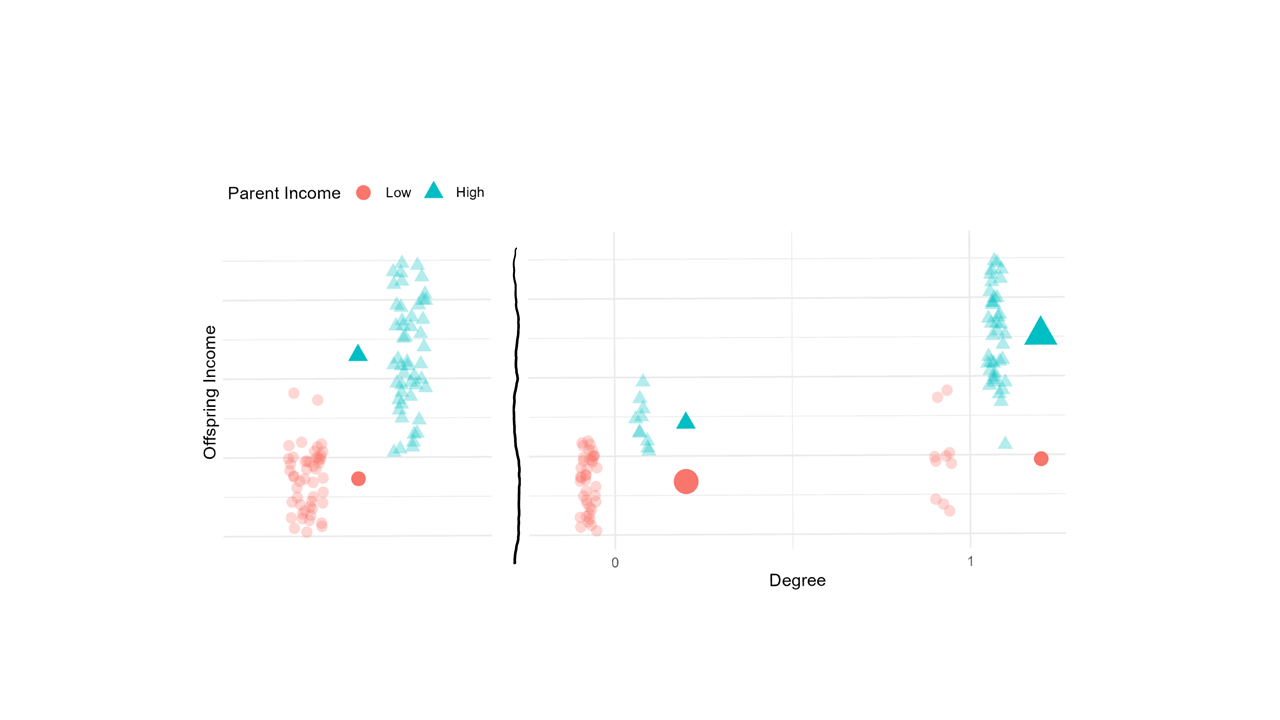
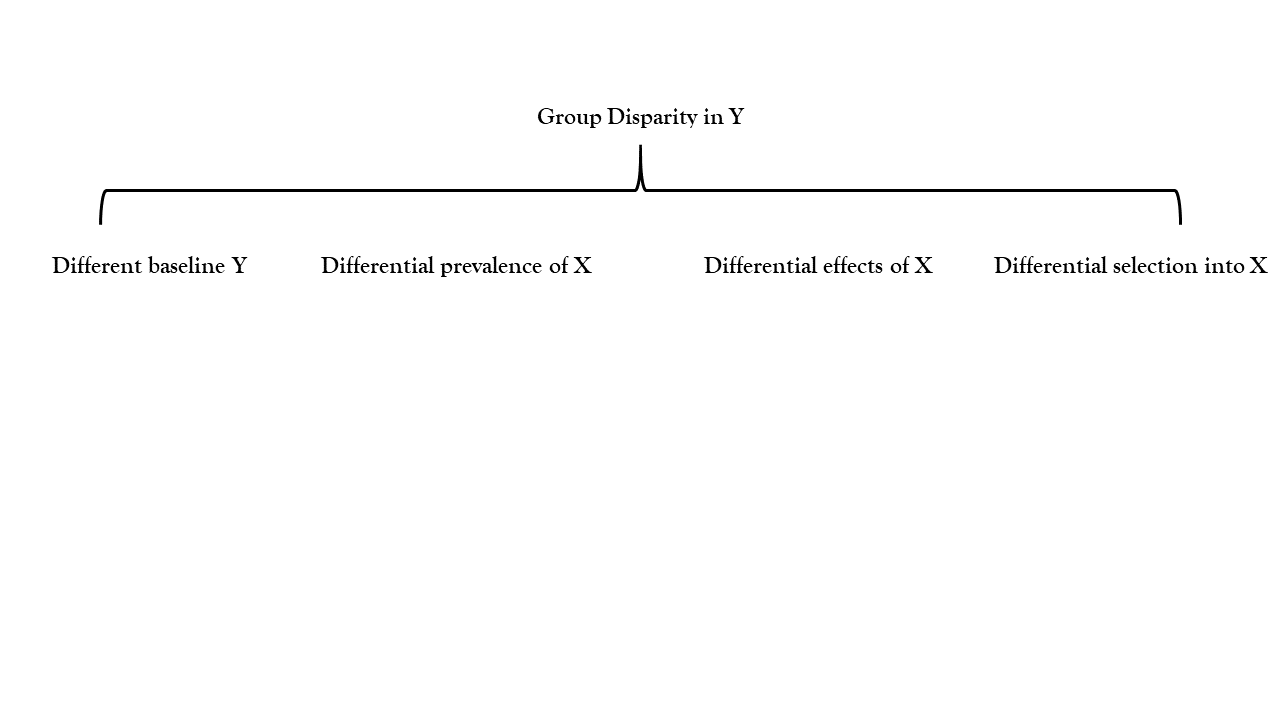
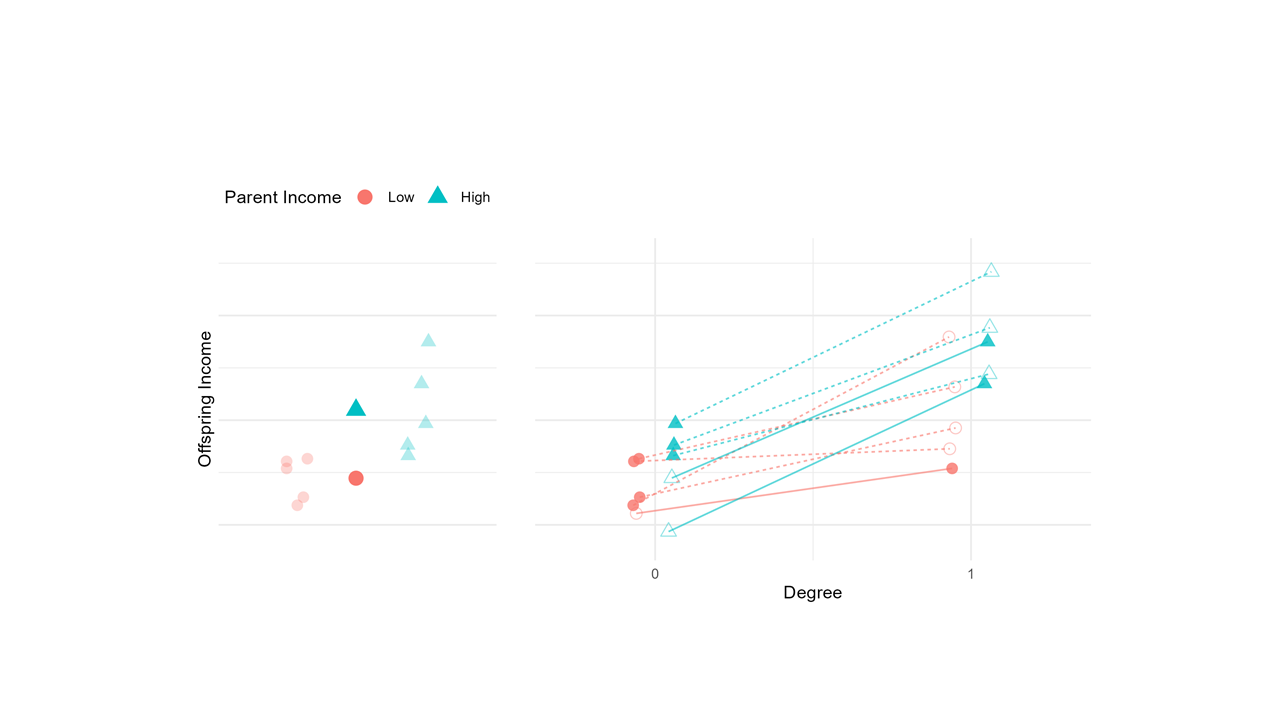
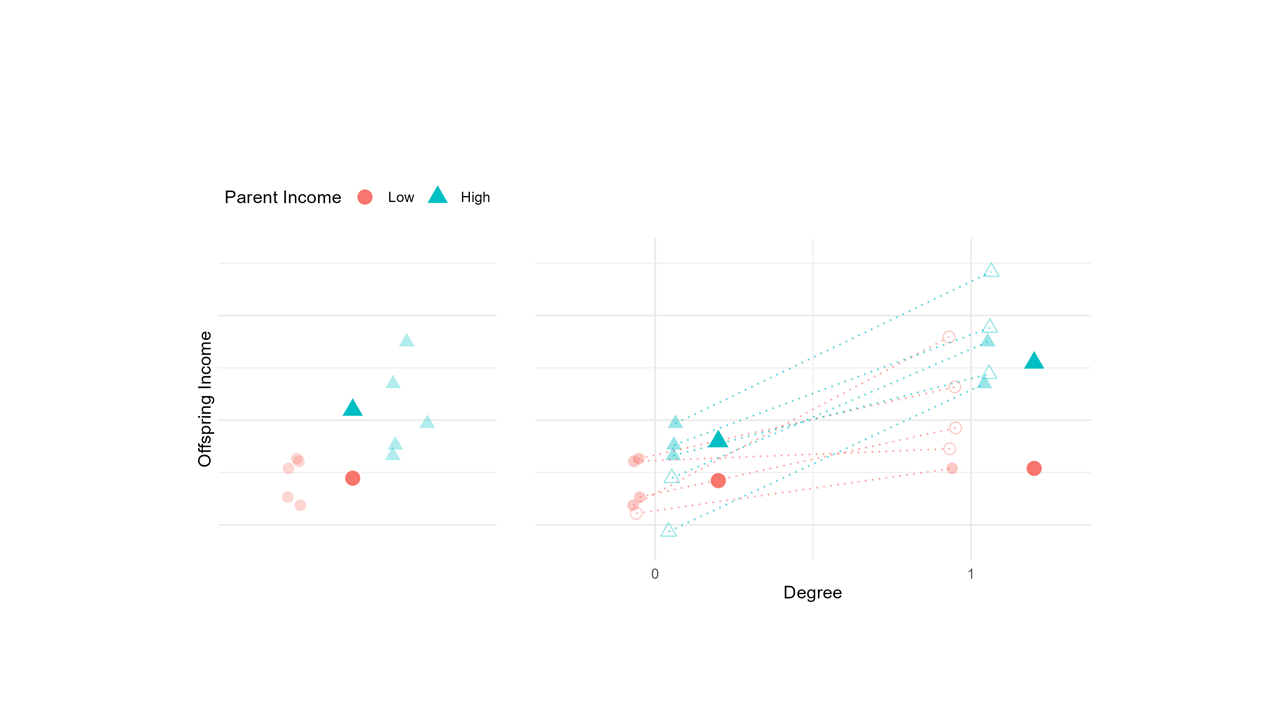
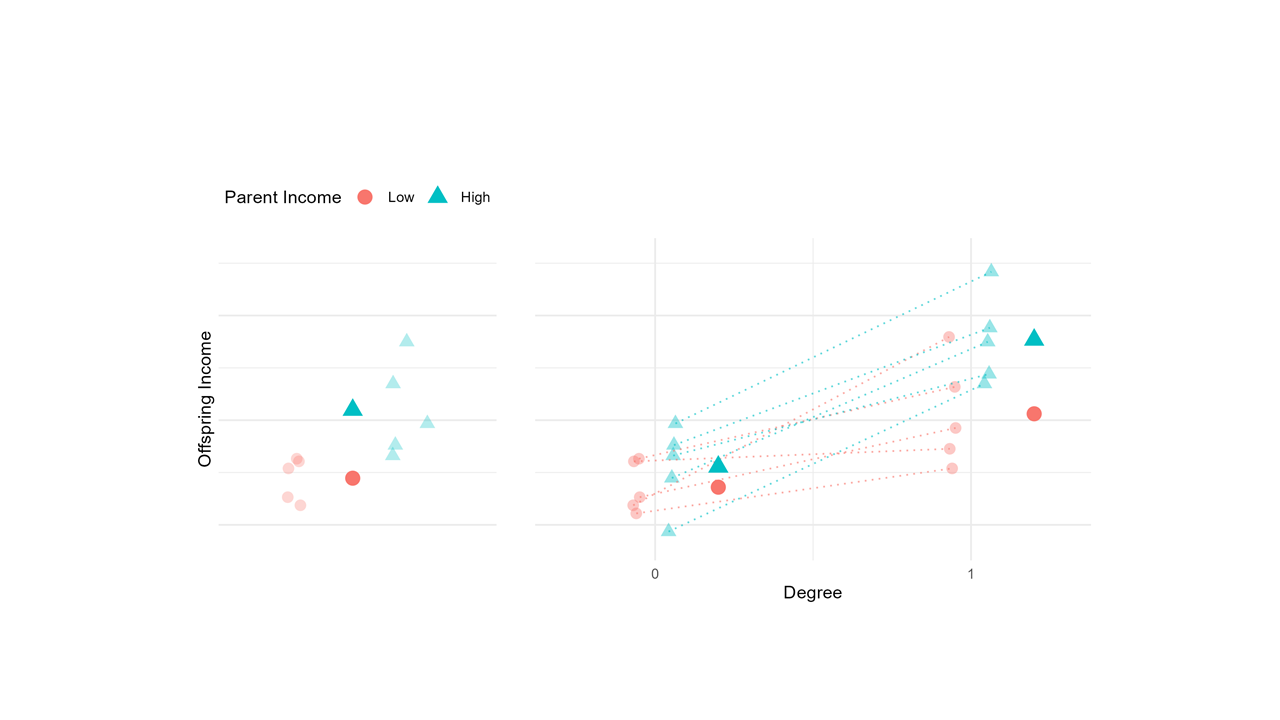
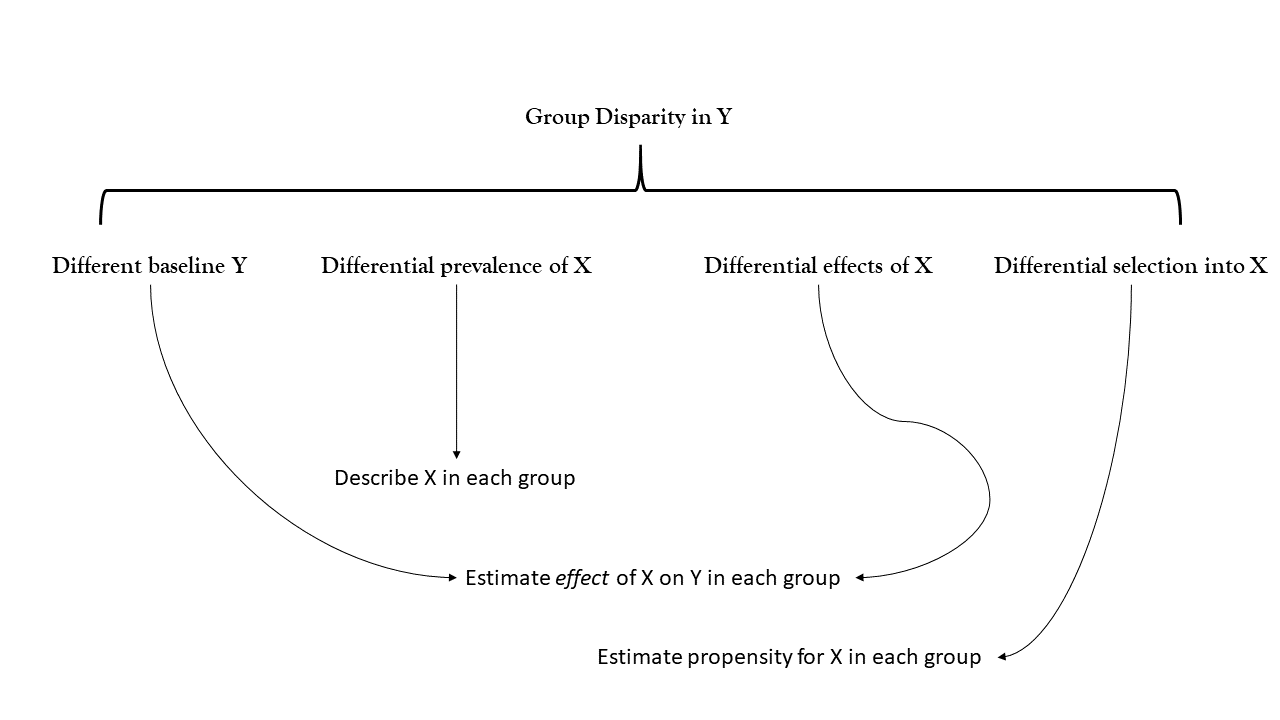
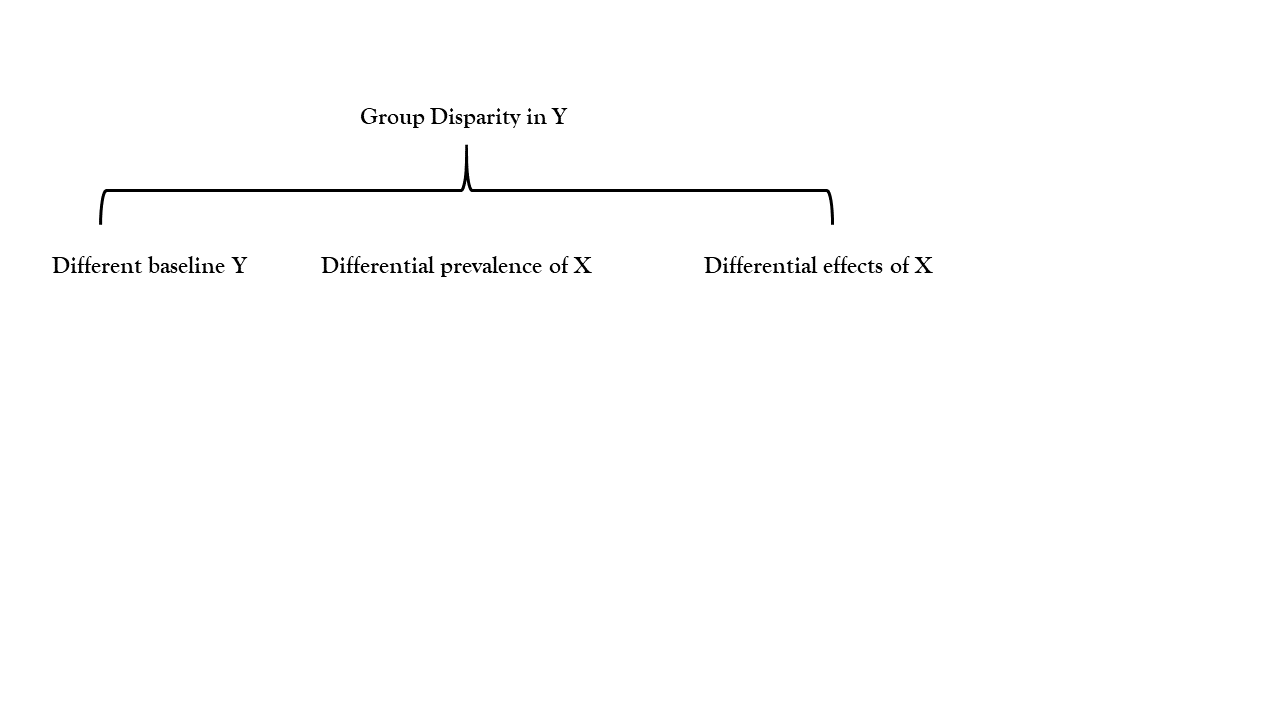
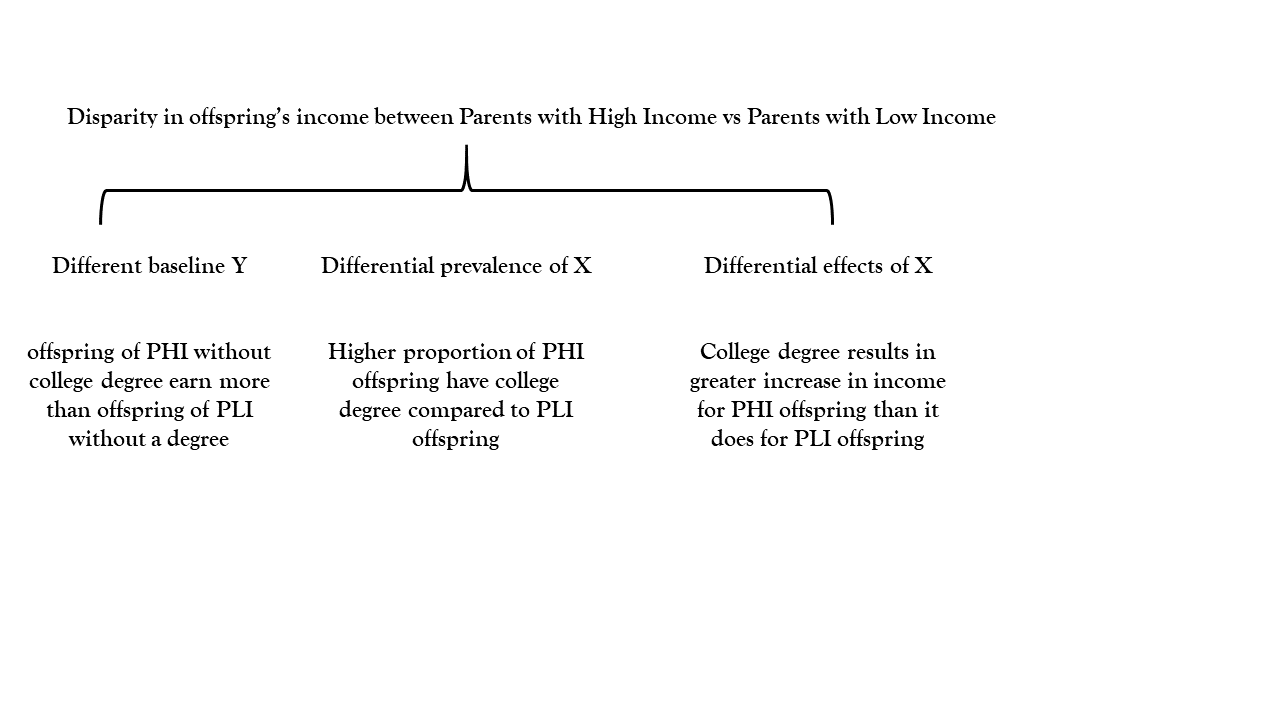
baseline, prevalence, effect

baseline, prevalence, effect

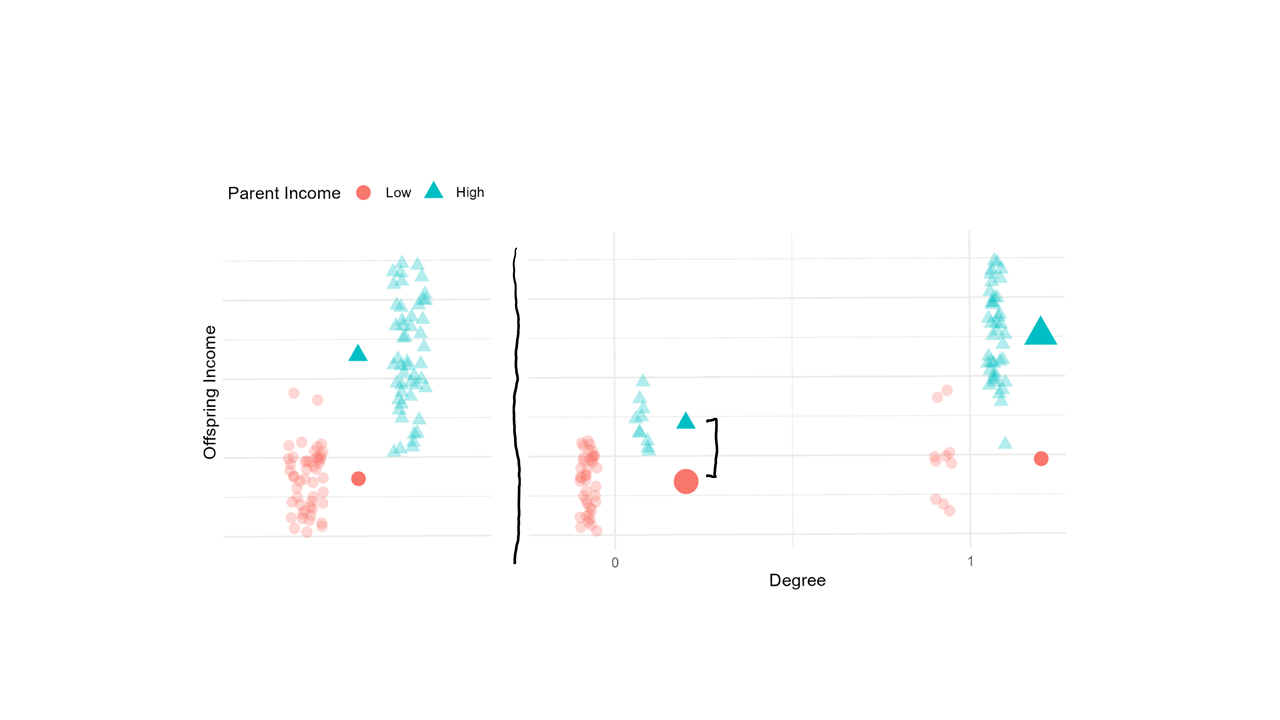
group disparity

baseline

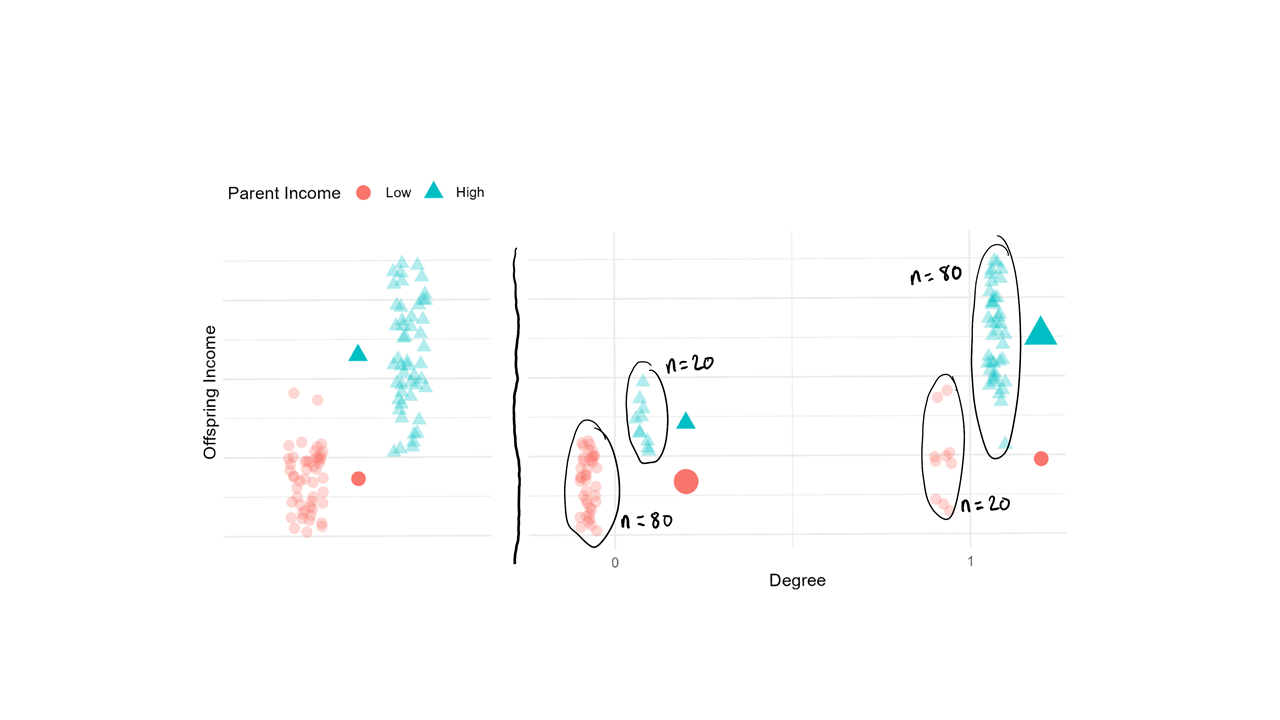
prevalence

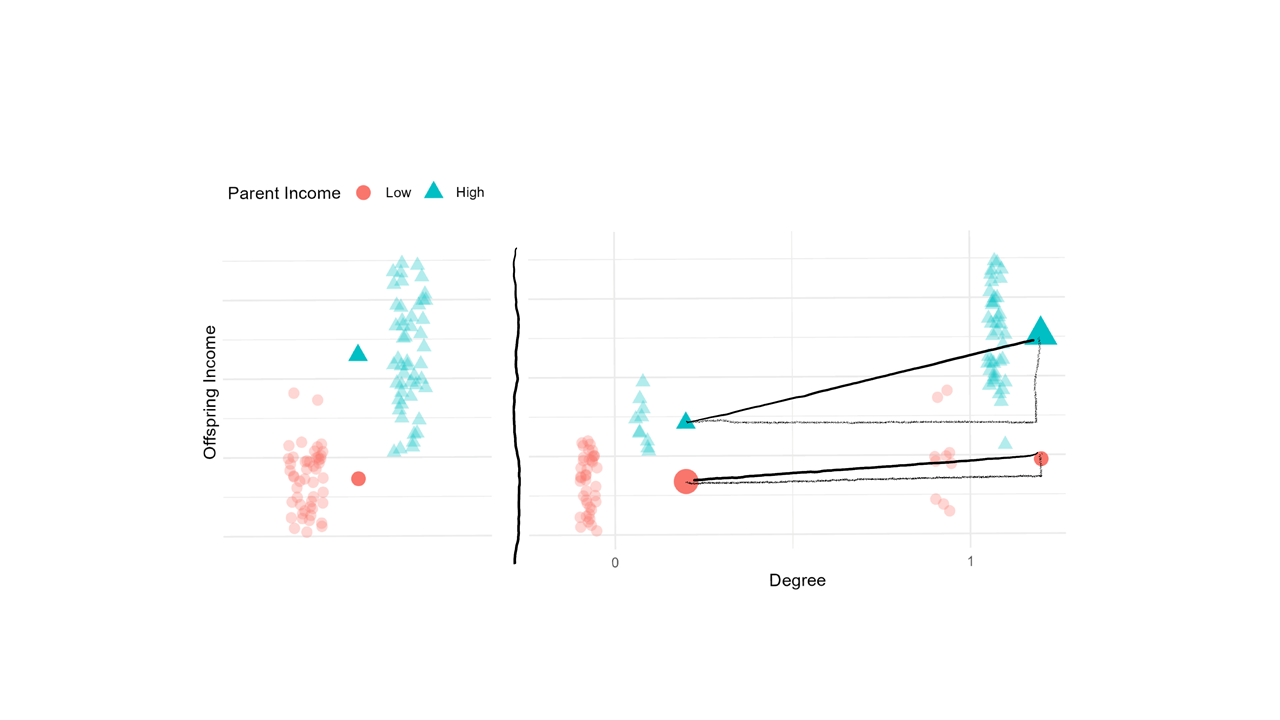
effect

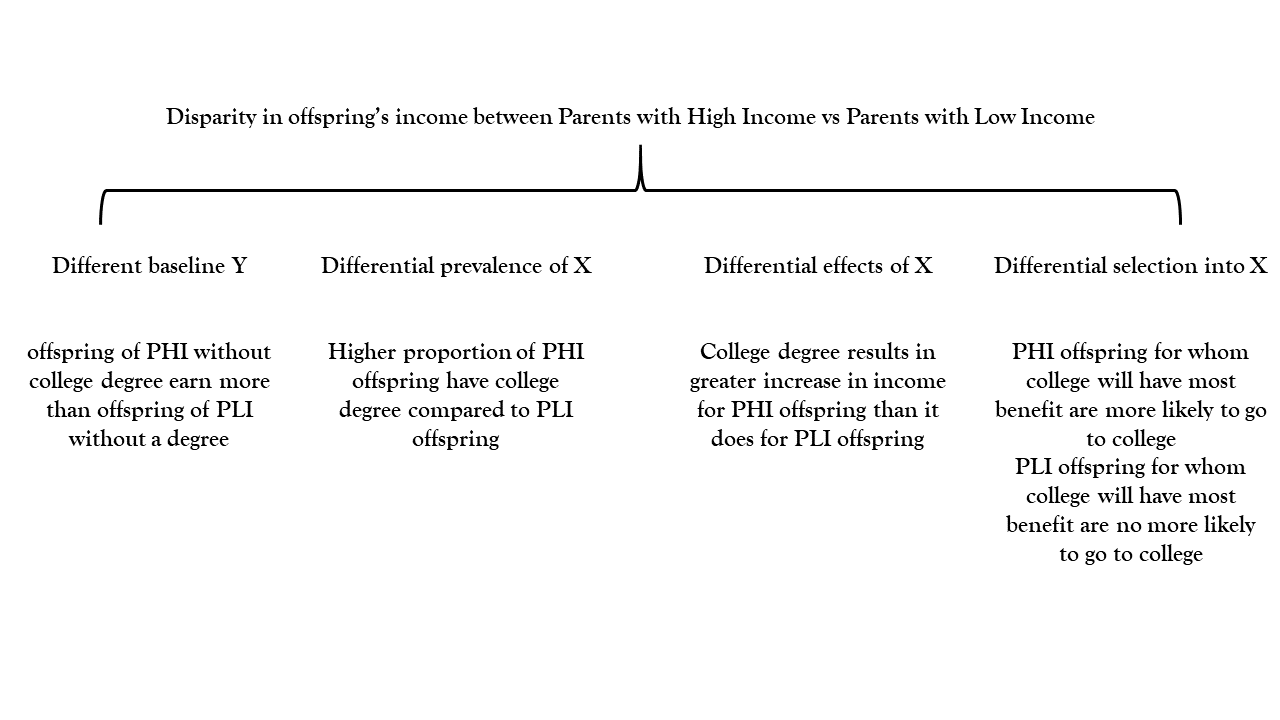
baseline, prevalence, effect, selection

End